Performance analysis
Last updated: 26 October 2026
A few examples of team performance indicators
Given the sheer volume and variety of statistical data, it's often hard to form a clear picture of a team's performance trends.
This website aims to simplify analysis by providing focused tools and key performance indicators.
Below are a few examples of the types of statistical indicators featured on SoccerSTATS.com.
Points Performance Index
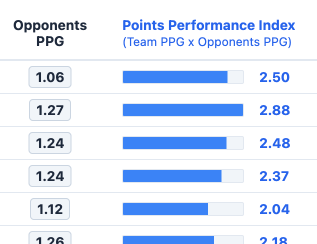
The Points Performance Index (PPI) quantifies the quality of points a team has accumulated. It's calculated for each team by multiplying their Points Per Game (PPG) by the average PPG of the opponents they have already played. This accounts for the "difficulty level" of their schedule.
Calculation
Points Performance Index = Team PPG x played opponents PPG
Purpose
To differentiate between teams with the same total points but varying strengths of opposition faced. For example, winning three matches against top teams yields a higher PPI than winning three matches against weaker opponents.
Relative Form
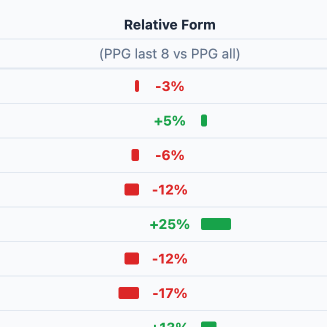
Unlike a basic "form table" that might only consider recent matches (e.g., the last 8), the Relative Form table provides a more nuanced view of a team's recent performance. It compares a team's PPG over their last 8 matches to their overall season average PPG.
Calculation
Relative Form = PPG (last 8 matches) vs. PPG (all matches)
Purpose
To identify teams that are currently performing "better than usual" or "worse than usual" relative to their own seasonal trend, rather than just against other teams.
Run-in analysis
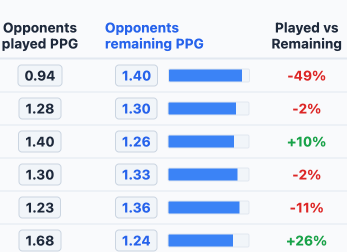
The Run-in Analysis table becomes increasingly interesting to look at towards the end of a season. For each team, it compares the PPG of their already-played opponents with the PPG of their remaining opponents.
Calculation
Run-in = Played Opponents' PPG vs. Remaining Opponents' PPG
Purpose
To reveal which teams have faced, or are yet to face, a more challenging or easier set of opponents.
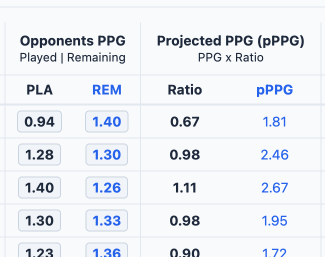
Projected Points
Building on the Run-in Analysis, the Projected Points table simulates a team's potential points tally from their remaining fixtures.
It considers the difference in PPG between a team's past and future opponents. A positive difference (stronger past opponents) results in a ratio greater than 1, while a negative difference (weaker past opponents) yields a ratio less than 1.
This ratio is then applied to the team's current PPG to derive a "Projected PPG".
Finally, Projected Points are calculated by multiplying this Projected PPG by the number of remaining matches.
Calculation
Projected Points = Team Current PPG x (Played Opponents' PPG / Remaining Opponents' PPG) x Number of Remaining Matches
Purpose
To simulate a team's potential projected points tally by adjusting their current performance for the assumed difficulty of their remaining schedule.
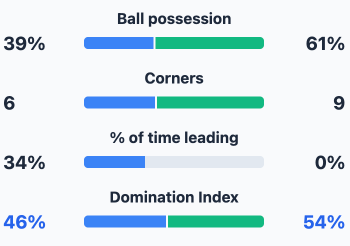
Domination Index
The Domination Index is a match-level indicator that assesses a team's overall control during a game. It averages three key percentages: possession, corners awarded, and duration of time spent in the lead.
Calculation
Domination Index = ([%Possession x 4] + %Corners + [%Lead Duration x 2]) / 7
Purpose
To provide a holistic view of match dominance, moving beyond just possession. It acknowledges that a team leading comfortably might focus on control rather than relentless attack, which is still a form of domination.